Evaluation (Metrics & Comparisons)
Comparative Visualizations of Precision@k, Recall@k, MAP, NDCG for Various Search Algorithms and Embedders using our verified relevance labels
In search, the top results carry most of the value, and logically so. If I return you a list of results where the primary document is a needle in the haystack, everyone would critisize the search and you may never get the answers you seek. That’s why we grade our systems primarily on performance at small k (e.g., 3, 5, 10), which is tantamount to asking:“How good are the first results you show?”
- Low-k focus. We emphasize precision and ranking quality for the first few hits—this is what users see and trust.
- Breadth vs. sharpness. Precision@k tends to drop as k grows; Recall@k rises—use both to balance accuracy and coverage.
- Order matters. MAP and NDCG reward getting relevant items early; two lists with the same members can earn very different scores depending on their order.
Precision@k = (# relevant in top k) / k
Recall@k = (# relevant retrieved up to k) / (total # relevant)
MAP = mean_q( avg_i Precision@rank(relevant_i) )
NDCG@k = DCG@k / IDCG@k where DCG@k = Σ (rel_i / log2(i+1))
assets/eval/Eval_viz.png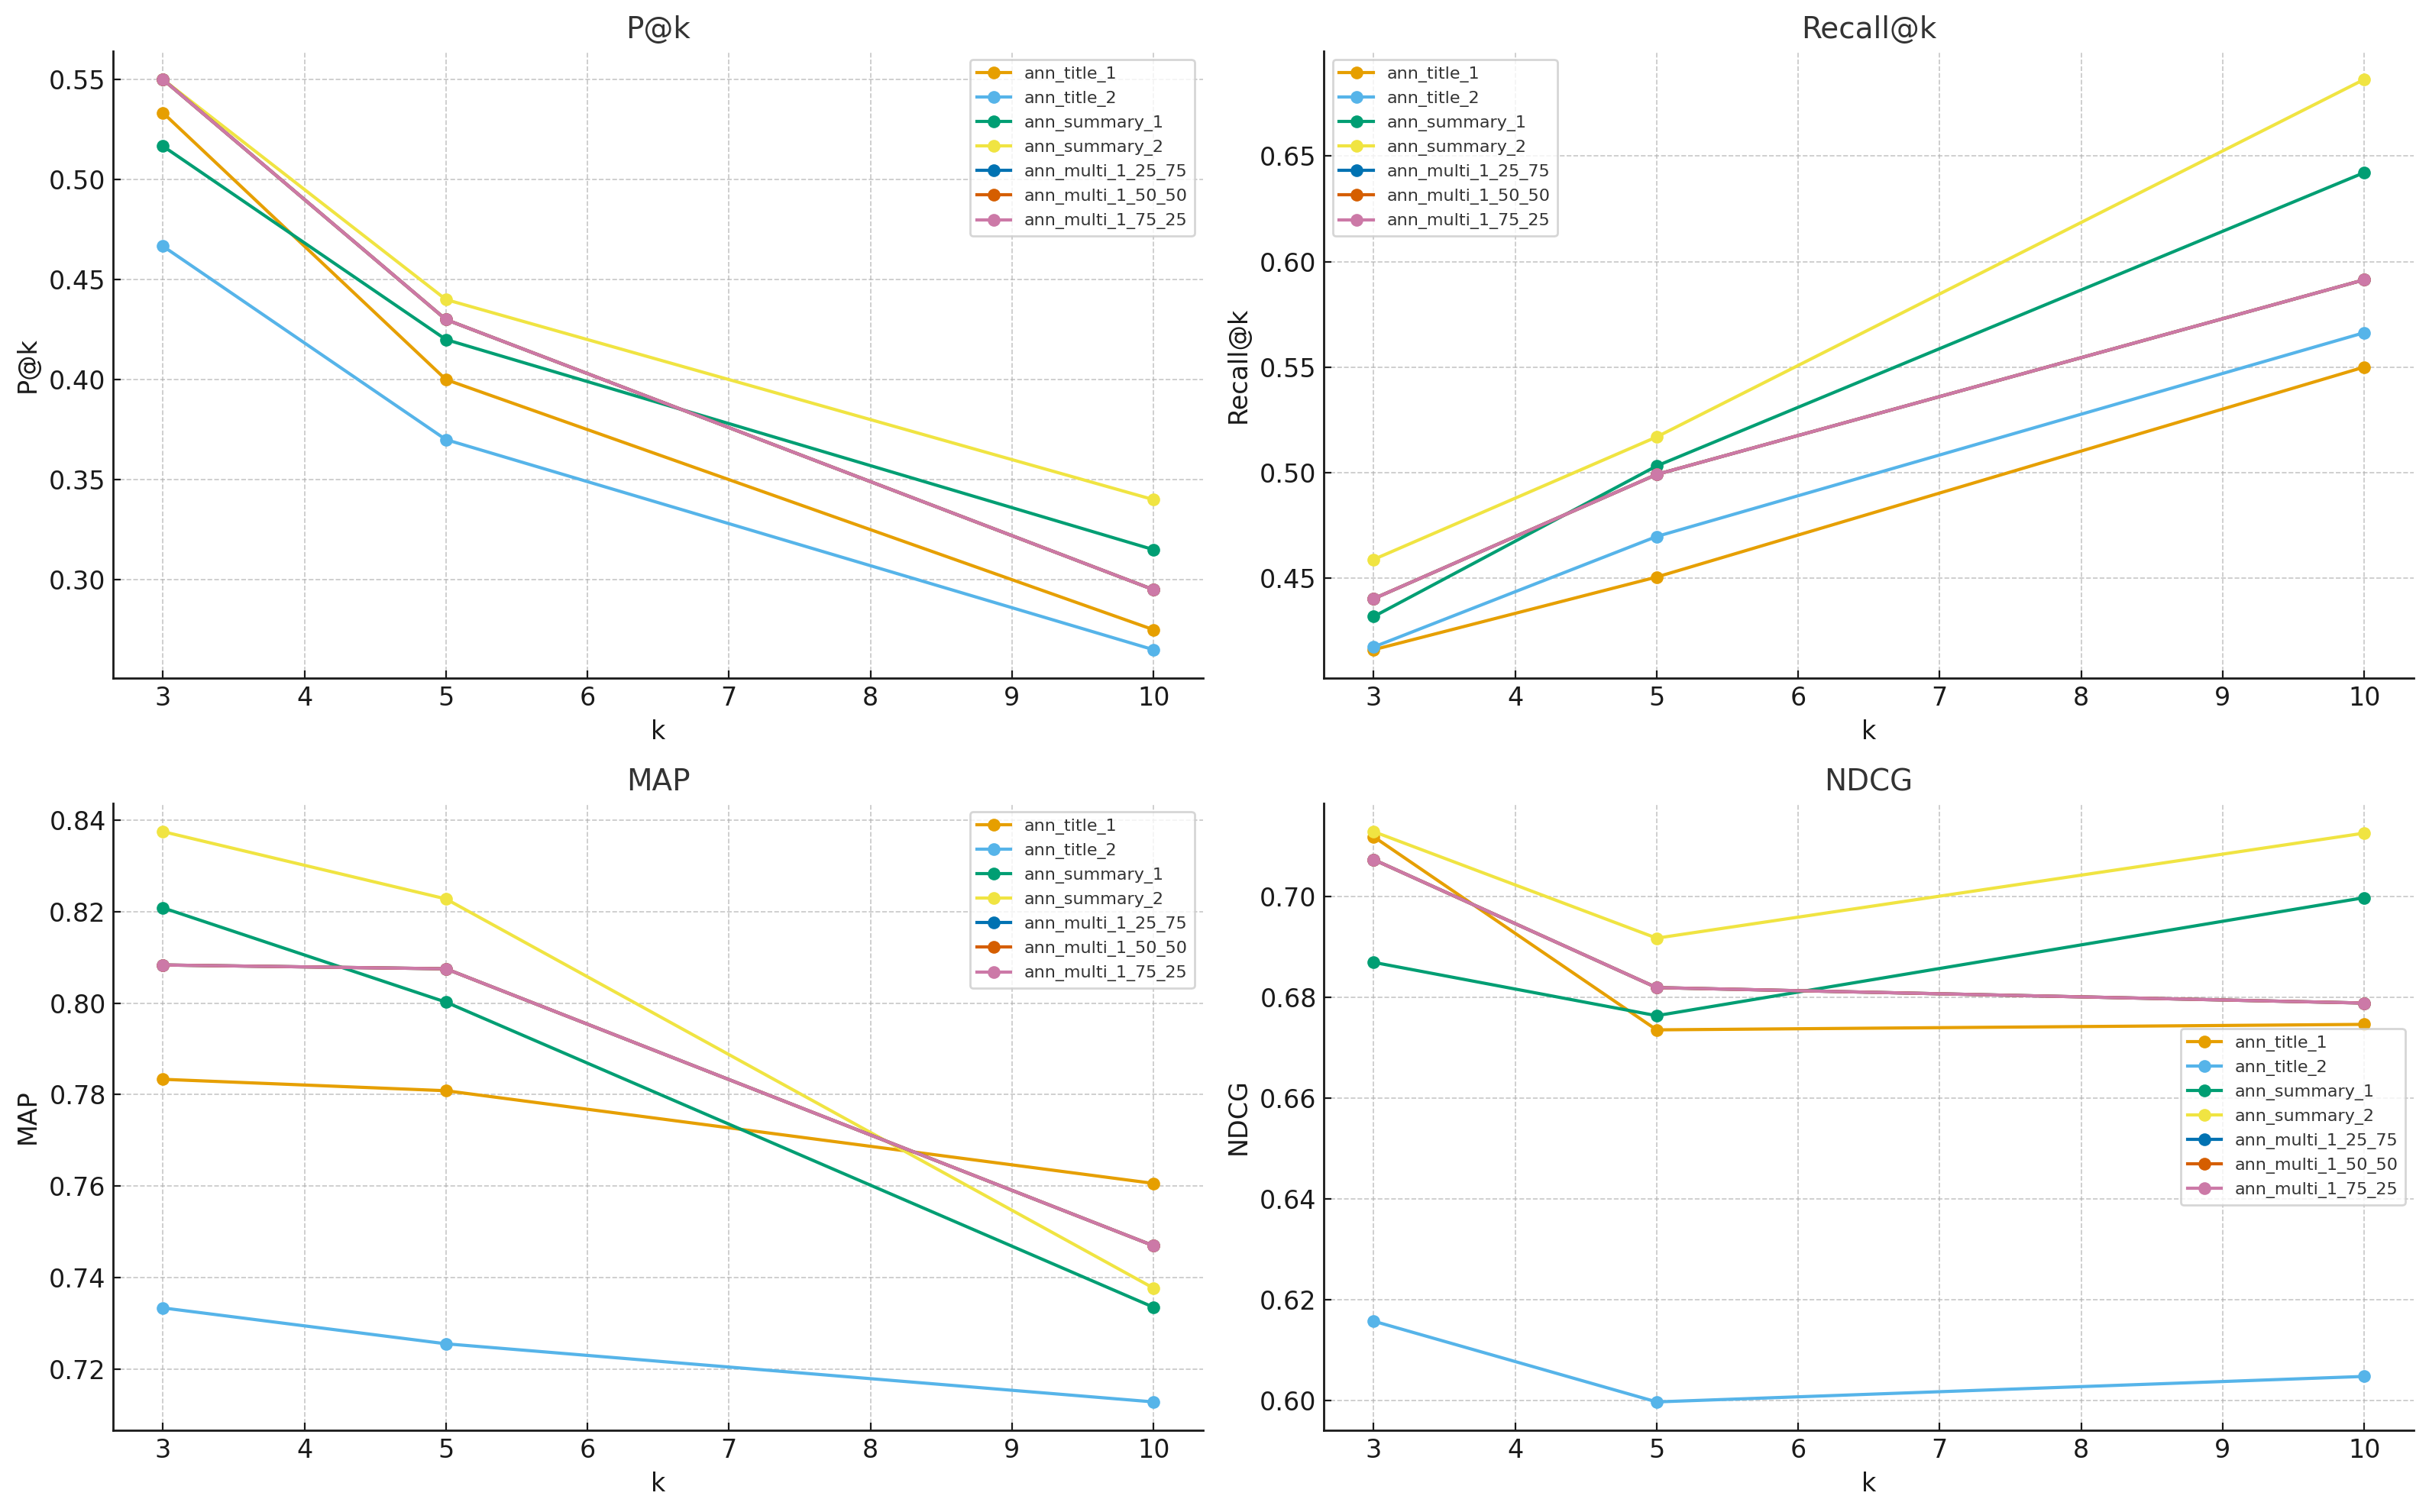
summary.csv…Leaderboard
| Run | k | P@k | Recall@k | MAP | NDCG | n_queries |
|---|
Per-Query Drilldown
- ✓ Graph Neural Nets for EHR (2509.111)
- ✓ RAG over Clinical Notes (2509.112)
- ✓ Message Passing Tricks (2509.113)
- ✗ Temporal GNN Benchmarks (2509.114)
- ✗ Contrastive Pretraining (2509.115)
- ✓ GNN Survey (2509.211)
- ✗ Indexing Tricks (2509.212)
- ✗ GNN for Images (2509.213)
- ✓ EHR Time Series (2509.214)
- ✗ Transformers for EHR (2509.215)
Interpretation
Across metrics and cutoffs, — comes out on top most often. In our current snapshot, that’s ann_summary_2 — the run that uses the OpenAI embedding on document summaries. Practically, it returns the most relevant items near the top, and its advantage is most visible on rank-sensitive metrics like NDCG and on breadth-sensitive Recall@10.
- Why summaries help: compact, information-dense text captures the core semantics better than titles alone; the embedding sees more signal per token.
- Why OpenAI Embeddings: Sometimes NLP models perform better because they were trained on language more similar to the task. Or it might be that OpenAI's embedders represent language with 1536 dimensions, compared to our sentence-transformer model that only does 384, which logically allows for more facets of semantics to be measured and utilized in vector search.
- Trade-offs: title-only profiles can sometimes be more direct semantic representations when compared with large bodies of text, which is why we test across features, not to mention models, in order to ensure the best search.